I understand that many of you reading this have never worked in a security operations centre (SOC), but there’s a good chance you’ve seen them in movies:
Sterile, brightly lit rooms of  computer screens. All showing spreadsheets or charts or static maps of the world.
And yet the men and women working this environment 24/7 are responsible for detecting network anomalies or sorting out the bad traffic patterns from among the thousands of false positive bad traffic patterns that show up on their screens hourly.
Little wonder the poor security analysts over at Target missed evidence that was right in front of them. The sheer enormity and chaos of data that assaults them in the course of their workday is stressful and overwhelming. All the screens look the same, tables and columns, and rows of information about network and security events collected and forwarded by every device on the network. Then hundred or thousands of rules process them to try to find deviations from “normal traffic“.
I’ve worked in or around these systems for the past two decades. I’ve seen the tools appear, mature, merge, morph, and become “fairly” useable. But the false positives are still rampant, and low and slow advanced persistent threats are under the radar and typically don’t show up here.
So when an upstart security analytics company called me late in 2013 to show me what they had been working on, well, I couldn’t have cared less. They tried hard to influence me with their pedigree: from the minds ex-MI5 security intelligence employees, and funded by Autonomy founder Mike Lynch. But all big software stands on the shoulders of giants, right?
Then a few months ago, I went to attend a public demo of a new security system.
The tools of the system do not rely on rules or signatures or feeds from your network devices. Yet they do require network span or tap at critical aggregation points in your network, but they are able to watch, analyze, identify, and correlate your traffic over a period of time, and through machine learning techniques, develop and understanding of “normal traffic” within several contexts.
Darktrace touts themselves to be your “enterprise immune system”, in that it learns like the human body’s immune system, which has an understanding of “self” or what belongs or is normal, versus harmful foreign bodies like bacteria or viruses. After a period of mapping your environment’s traffic patterns: source/destination/port/protocol/time of day/day of year/etc, Darktrace will use its learning algorithms to alert on traffic patterns that are not normal, and therefore should be looked at. The difference here is the heuristic learning. Not rules, made be people who think they know the system.
Human Interface
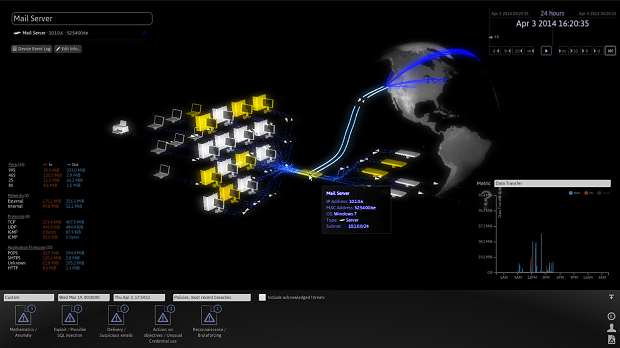
Remember up top where I said how monotonous it is to stare at a gazillion screens full of spreadsheets was? Darktrace reminded me of the tools seen in Minority Report. I got the feeling at first that this was canned video footage. But then the presenter selected one of those intensifying lights. As he zoomed, images of network devices started showing up. Lines between them glowing as well, in various intensities and colors. They then portrayed a communication session initiated from a desktop to a web server through a faint white line, after which there was immediately more light from that web server back to another device that turned out to be an associated database server, and then more illuminated lines back to the network storage array. That one transaction, a Web page request I would imagine, allowed me to visualize connectivity to the various subcomponents of the web applications infrastructure.
Be fore anyone had a chance to ask about those red glowing devices and lines, the presenter clicked one and detailed how this was not typical traffic from that particular device at this time of day, nor from the area of the network being connected. It was anomalous behavior, visible in real time.
